注意
前往結尾以下載完整的範例程式碼
WOE 轉換器
WOE 表示證據權重 (Weights of Evidence)。它包含檢查特徵 X 是否屬於一系列的區域 - 間隔 -。結果是包含該特徵的每個間隔的標籤。
一個簡單的範例
X 是由前十個整數組成的向量。類別 WOETransformer 會檢查它們每一個是否屬於兩個間隔,]1, 3[ (左開右開) 和 [5, 7] (左閉右閉)。第一個間隔與權重 55 關聯,第二個間隔與權重 107 關聯。
import os
import numpy as np
import pandas as pd
from onnx.tools.net_drawer import GetPydotGraph, GetOpNodeProducer
from onnxruntime import InferenceSession
import matplotlib.pyplot as plt
from skl2onnx import to_onnx
from skl2onnx.sklapi import WOETransformer

# automatically registers the converter for WOETransformer
import skl2onnx.sklapi.register  # noqa

X = np.arange(10).astype(np.float32).reshape((-1, 1))

intervals = [[(1.0, 3.0, False, False), (5.0, 7.0, True, True)]]
weights = [[55, 107]]

woe1 = WOETransformer(intervals, onehot=False, weights=weights)
woe1.fit(X)
prd = woe1.transform(X)
df = pd.DataFrame({"X": X.ravel(), "woe": prd.ravel()})
df
獨熱編碼
轉換器會輸出一個包含權重的欄位。但它也可以傳回每個間隔一個欄位。
在這種情況下,可以省略權重。輸出為二進位。
轉換為 ONNX
skl2onnx 為所有情況實作轉換器。
onehot=False
onx1 = to_onnx(woe1, X)
sess = InferenceSession(onx1.SerializeToString(), providers=["CPUExecutionProvider"])
print(sess.run(None, {"X": X})[0])
[[  0.]
 [  0.]
 [ 55.]
 [  0.]
 [  0.]
 [107.]
 [107.]
 [107.]
 [  0.]
 [  0.]]
onehot=True
onx2 = to_onnx(woe2, X)
sess = InferenceSession(onx2.SerializeToString(), providers=["CPUExecutionProvider"])
print(sess.run(None, {"X": X})[0])
[[  0.   0.]
 [  0.   0.]
 [ 55.   0.]
 [  0.   0.]
 [  0.   0.]
 [  0. 107.]
 [  0. 107.]
 [  0. 107.]
 [  0.   0.]
 [  0.   0.]]
ONNX 圖形
onehot=False
pydot_graph = GetPydotGraph(
    onx1.graph,
    name=onx1.graph.name,
    rankdir="TB",
    node_producer=GetOpNodeProducer(
        "docstring", color="yellow", fillcolor="yellow", style="filled"
    ),
)
pydot_graph.write_dot("woe1.dot")

os.system("dot -O -Gdpi=300 -Tpng woe1.dot")

image = plt.imread("woe1.dot.png")
fig, ax = plt.subplots(figsize=(10, 10))
ax.imshow(image)
ax.axis("off")
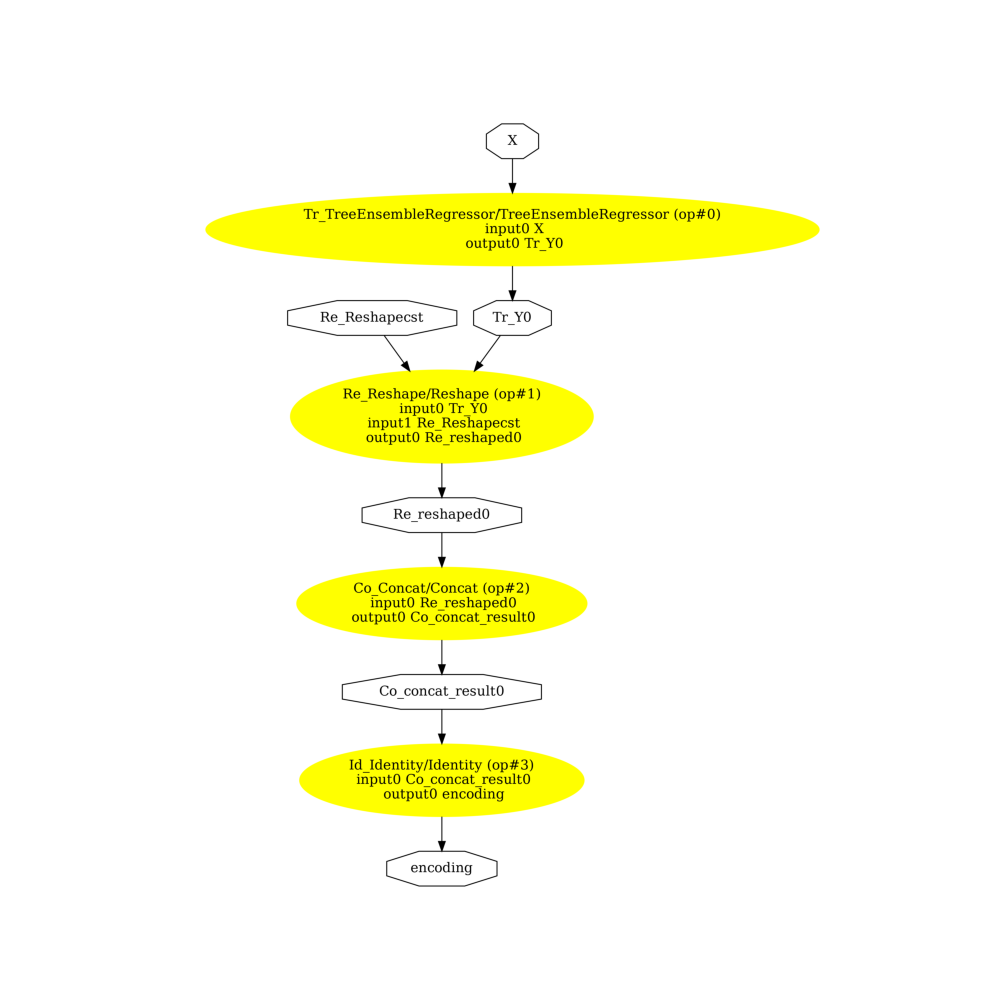
(-0.5, 2674.5, 3321.5, -0.5)
onehot=True
pydot_graph = GetPydotGraph(
    onx2.graph,
    name=onx2.graph.name,
    rankdir="TB",
    node_producer=GetOpNodeProducer(
        "docstring", color="yellow", fillcolor="yellow", style="filled"
    ),
)
pydot_graph.write_dot("woe2.dot")

os.system("dot -O -Gdpi=300 -Tpng woe2.dot")

image = plt.imread("woe2.dot.png")
fig, ax = plt.subplots(figsize=(10, 10))
ax.imshow(image)
ax.axis("off")
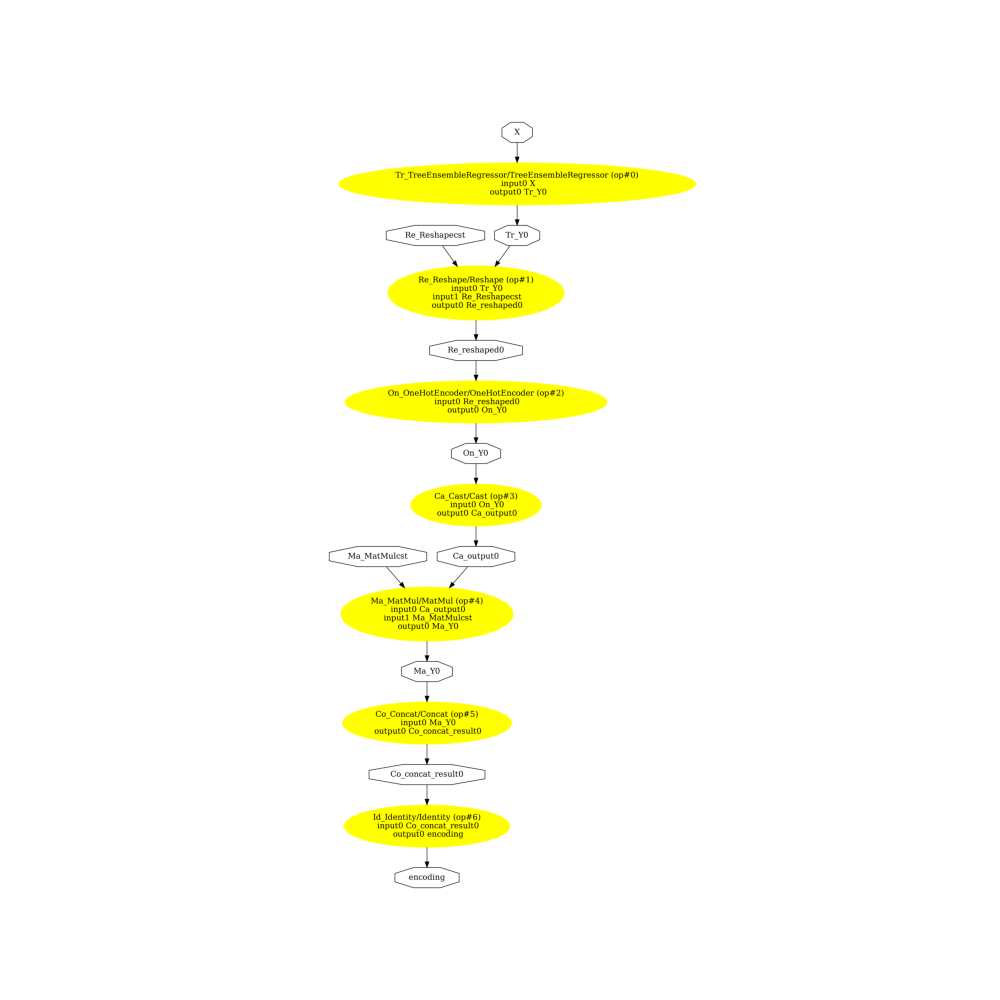
(-0.5, 2743.5, 5696.5, -0.5)
半線
一個間隔可能只有一個定義的極值,而另一個可能是無限的。
使用相同的指令轉換為 ONNX。
onxinf = to_onnx(woe1, X)
sess = InferenceSession(onxinf.SerializeToString(), providers=["CPUExecutionProvider"])
print(sess.run(None, {"X": X})[0])
[[ 55.]
 [ 55.]
 [ 55.]
 [ 55.]
 [  0.]
 [107.]
 [107.]
 [107.]
 [107.]
 [107.]]
腳本總執行時間:(0 分鐘 3.955 秒)